
Date: 05/30/2026
Blog Post by: Yari
Inside the sound, movement, code, and psychology behind our AIoT behavioral-awareness prototype.
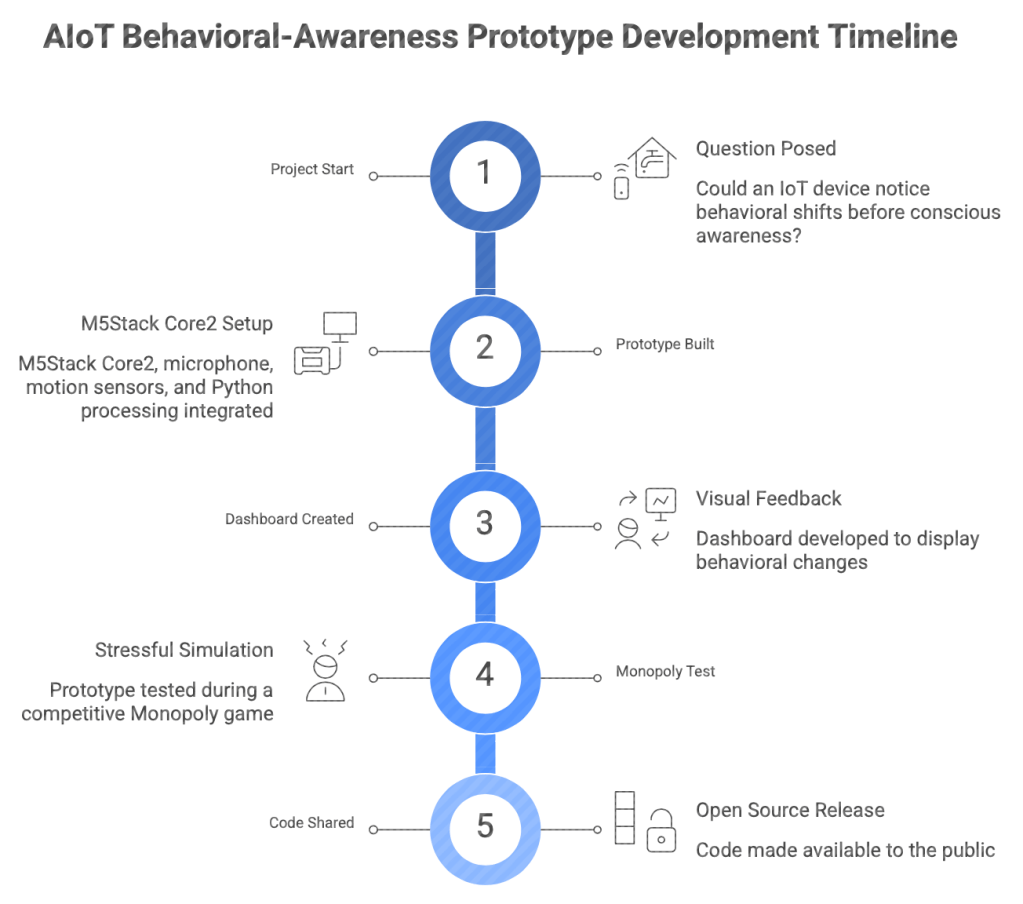
Does stress have a pipeline? Well, yes an IoT device could track behavioral changes and prompt a person to pause or refocus. Most of the devices in your home, from cameras to electronic watches, follow a similar pipeline: a simple breakdown, so simple that it is often overlooked. A prototype IoT device could track behavioral changes and prompt a person to pause or refocus. The project began with one simple question: Could an Internet of Things device (IOT) notice those behavioral shifts before a person consciously named them?
The answer is yes, and now so can you using the same code, because coders do not gate keep.
It’s entirely possible to create a behavioral awareness prototype that monitored changes in sound and motion patterns that may be associated with stress, fatigue, distraction, or cognitive overload. It was designed to prompt self-awareness, not diagnose stress.
What started as a technical prototype using a small M5Stack Core2 device, a microphone, motion sensors, Python processing, and a dashboard became the device that monitored changes in movement and sound that occurred during mentally demanding moments and translated them into visible feedback.
We were able to test it during a highly competitive Monopoly game in which my BF bankrupted both me and my project partner twice. Heartless, I know, but anything for the advancement of science and the chance to be the next Tony Stark.
The Idea was simple: Stress can Leave Behavioral Traces
Stress is psychological, but it can be physical as well. Under cognitive or emotional demand, people may shift posture, tap, fidget, touch their face, sigh, speak differently, or become more restless. These behaviors are not universal signs of stress because of cultural differences, and any single gesture can have many explanations. Someone might tap because they are bored, cold, energetic, distracted, or simply listening to music.
Psychology research supports the broader idea behind our prototype: cognitive and emotional demands can influence observable nonverbal behaviors, including movement and self-directed gestures. Research on vocal behavior has also found that stress can influence acoustic speech characteristics, including pitch, voice quality, and speaking patterns.
The lesson is not that a tap or a sigh equals stress. The lesson is that patterns, when compared against a person’s own baseline and interpreted cautiously, can become useful signals for self-awareness. From there, the pipeline for the device needed to be developed.
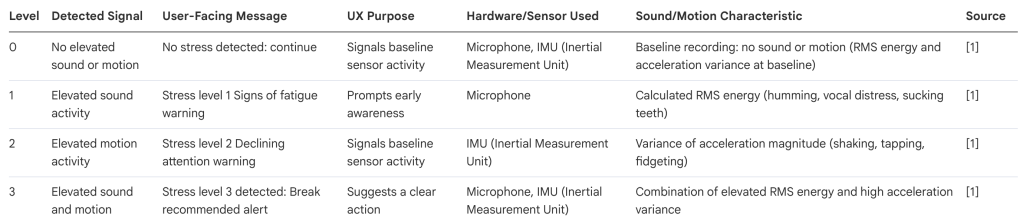
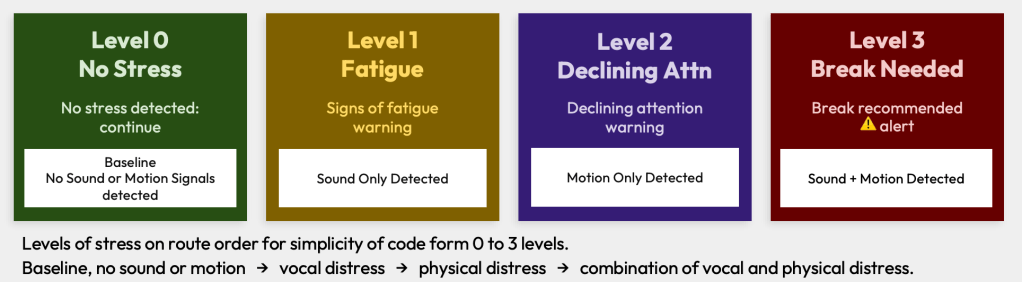
For simplicity in the code, stress levels were ordered from Level 0 to Level 3:
Baseline activity → elevated vocal activity → elevated physical distress → combination of elevated vocal and physical distress.
It followed these level orders.
Level 0 print: No stress detected: ← this is the baseline (no sound or motion).
No sound or motion is detected.
On screen: No stress detected: continue
Level 1 print: signs of fatigue ← sound detected from the sample codes.
Based on stress sound signals detected
On screen: Stress level 1 Signs of fatigue warning
Level 2 print: declining attention ← motion detected from the sample codes
Based on stress motion signals detected
On Screen: Stress level 2 Declining attention warning
Level 3 print: break recommended ← sound and motion detected form the sample codes
Based on stress sound and motion signals detected
On Screen: Stress level 3 detected: Break recommended alert
The device used simple wellness oriented screen messages, such as ‘Signs of fatigue,’ ‘Declining attention,’ and ‘Break recommended,’ as feedback prompts rather than medical conclusions.
Once the pipeline was conducted, the device had to be taught what to monitor.
The M5Stack Core2 acted as the physical front end of the product. It used its built-in microphone to collect sound and its inertial measurement unit, or IMU, to collect motion.
The recording code guided the user through seven 5 second behaviors:
- 1 recording: Baseline recording = no sound or motion.
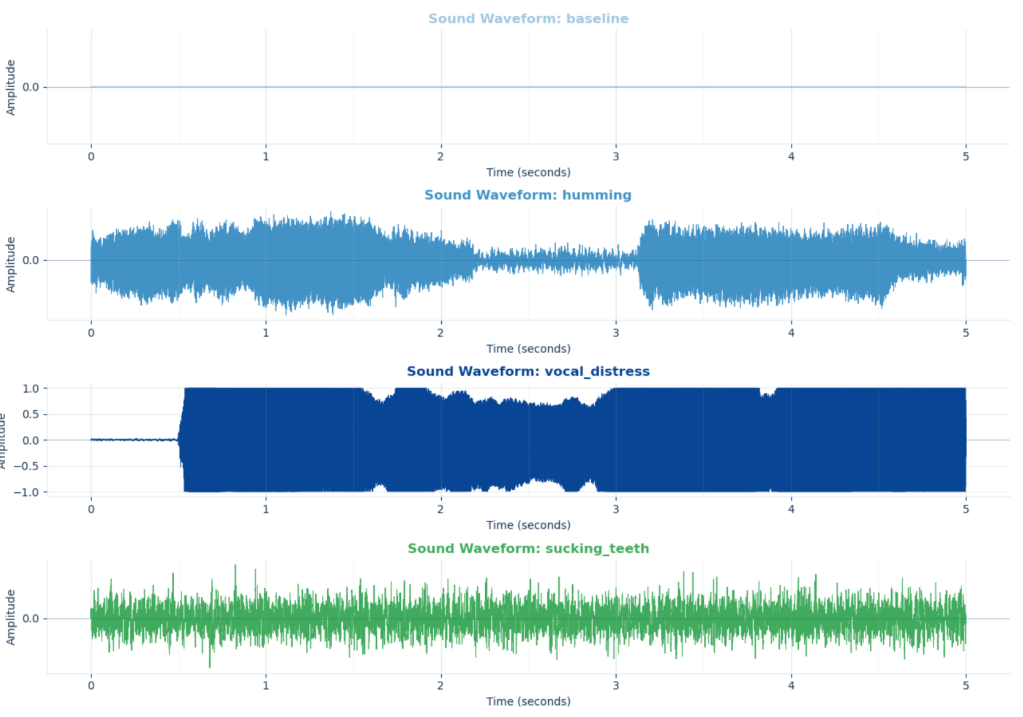
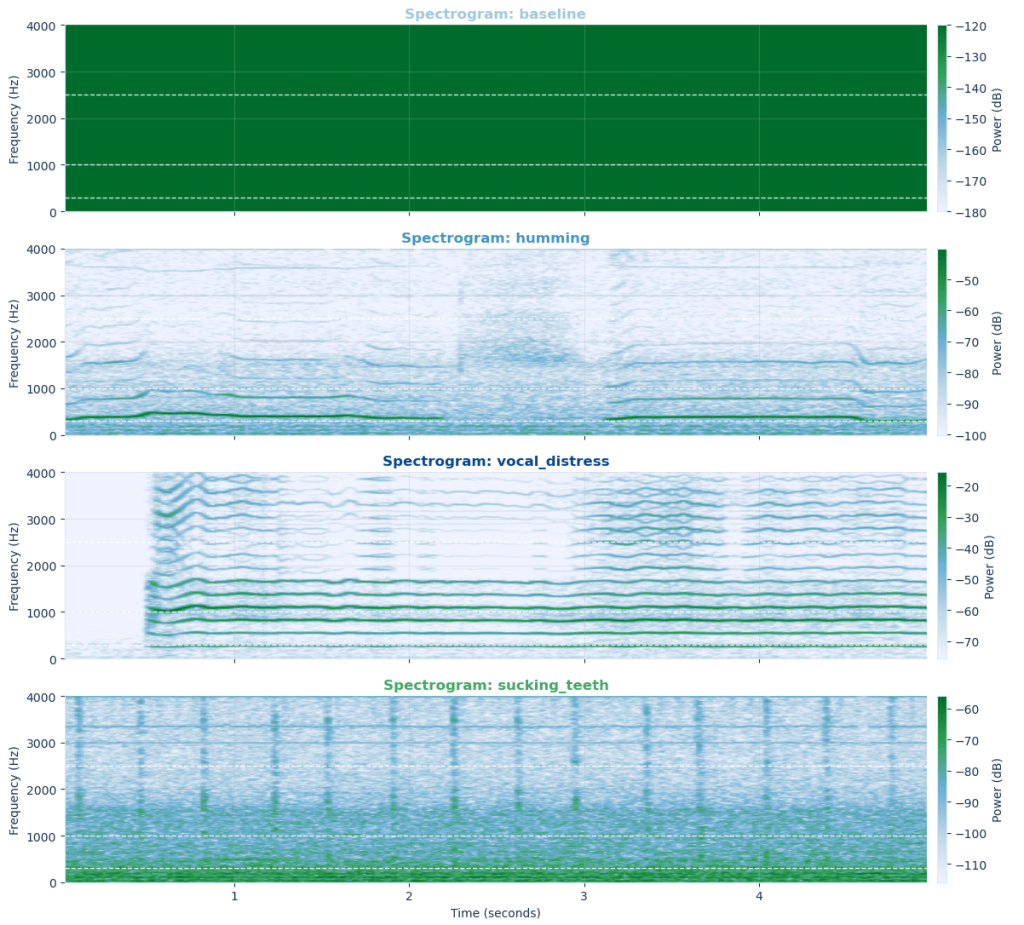
- 3 recordings: Sound recording = humming, vocal distress (sigh or scream), and sucking teeth.
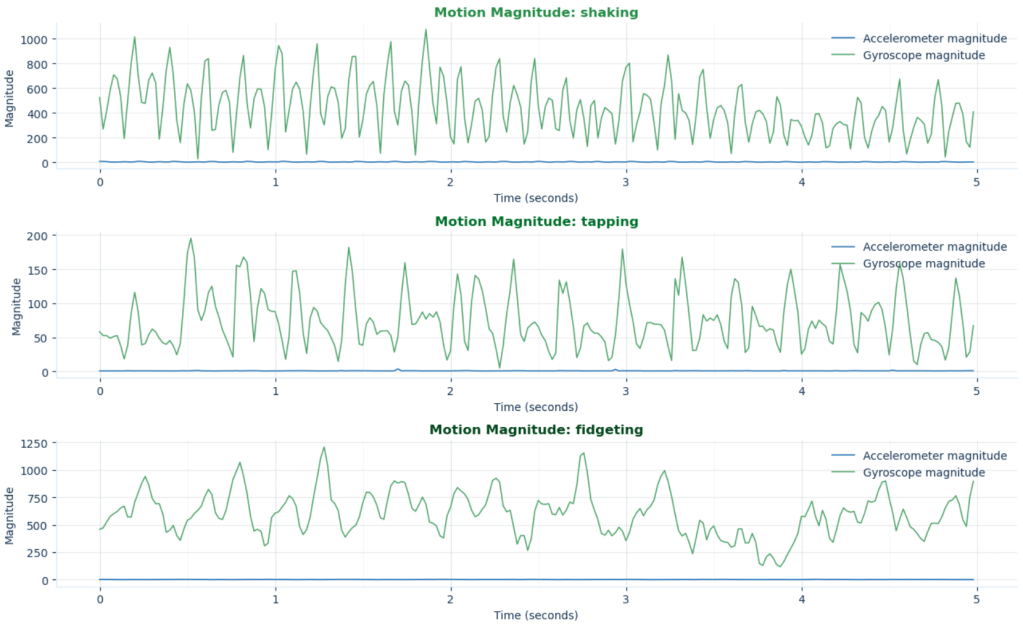
- 3 recordings: Motion recording = shaking (up and down motion), tapping (tapping on device), fidgeting (circular motion)
The sound recordings were saved as WAV files: baseline.wav, humming.wav, vocal_distress.wav, and sucking_teeth.wav.
The motion recordings were saved as CSV files: shaking.csv, tapping.csv, and fidgeting.csv.
The audio code recorded at 8,000 samples per second using 16-bit mono sound. That meant each five-second audio recording contained a compact but detailed representation of what the microphone heard.
Meanwhile, the motion collection script polled the accelerometer and gyroscope at 50 samples per second, collecting values across six channels: acceleration on the x, y, and z axes, plus rotation on the x, y, and z axes.
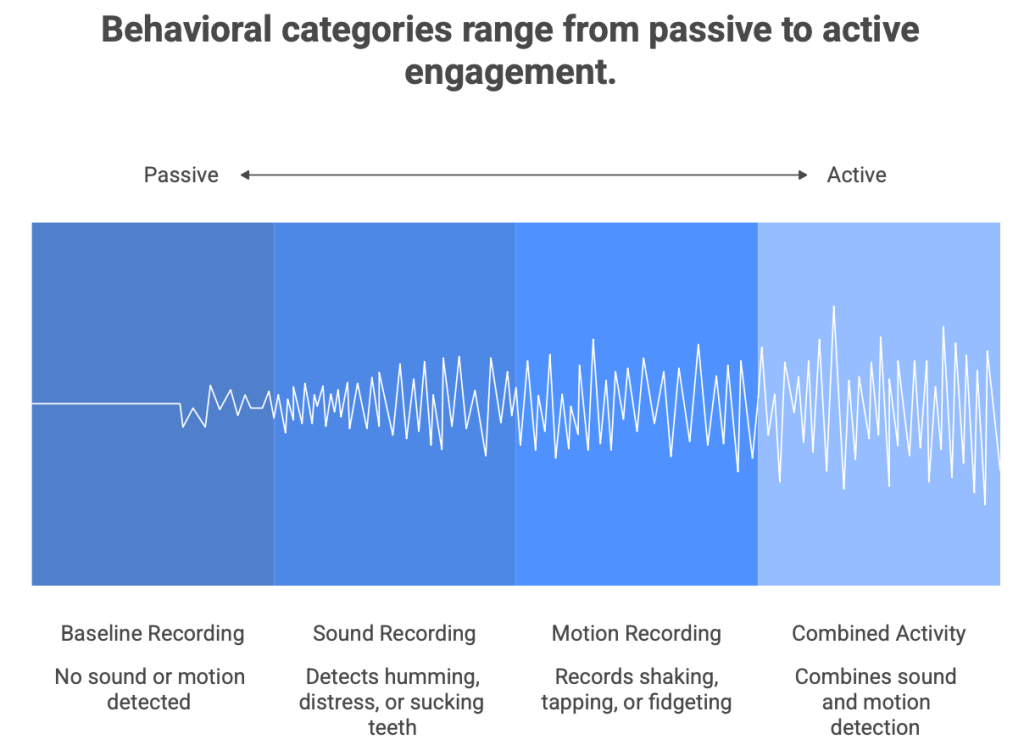
Each collected action represented a possible behavioral category: quiet baseline, sound based activity, motion based activity, or combined activity. Ultimately, the device needed comparison points before it could monitor anything live. The device needed comparison points before it could monitor anything live.
The Code Logic: Turning Behavior Into a Signal
Once the sample behaviors were collected, the Core2 entered live detection mode.
For sound, the code calculated RMS energy, a measurement of how intense an audio signal is across a short recording window. A quiet room should generate lower energy. A louder sigh, hum, or frustrated vocal sound should create higher energy.
For motion, the code measured the variance of acceleration magnitude. In simpler terms, it watched how much the device’s movement changed during a short burst of time. A still device would have relatively stable motion values. A shaking, tapping, or fidgeting device would create greater variation.
The original live detection logic then compared those two measurements against thresholds:
- no elevated sound and no elevated motion meant Level 0: no stress detected;
- elevated sound alone meant Level 1: signs of fatigue;
- elevated motion alone meant Level 2: declining attention;
- elevated sound and motion together meant Level 3: break recommended.
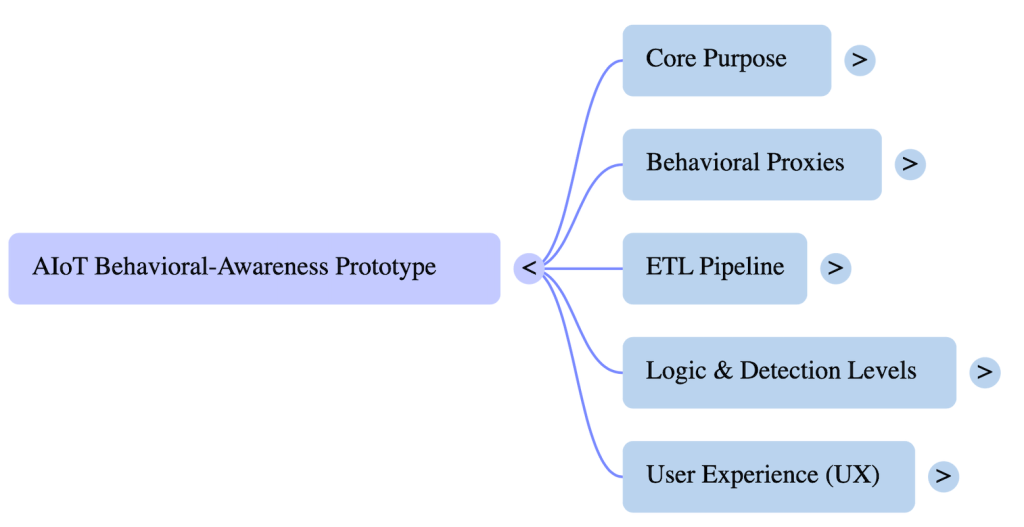
The ETL Pipeline: From Real Life to Real-Time Insight
At its core, the product was also an ETL system: Extract, Transform, Load.
The logic was intentionally simple. It didn’t pretend that a certain sound proved fatigue or that a certain movement proved stress. Instead, it converted behavioral intensity into an immediate feedback signal. Later, the final product design improved the logic by comparing incoming readings against an individual baseline. Rather than asking, “Is this movement high in general?” the system asks, “Is this movement unusually high for this person compared with their calm state?”
That’s where the z-score approach became important. A baseline session established typical motion and sound values. New five second feature windows could then be scored based on how far they deviated from those personal norms.
The final decision policy added another safeguard: the system would not trigger an alert from one noisy moment. It required elevated stress proxy scores across two consecutive windows. That concept, known as hysteresis, reduced false alerts caused by a single cough, chair movement, dropped pen, or burst of background noise.
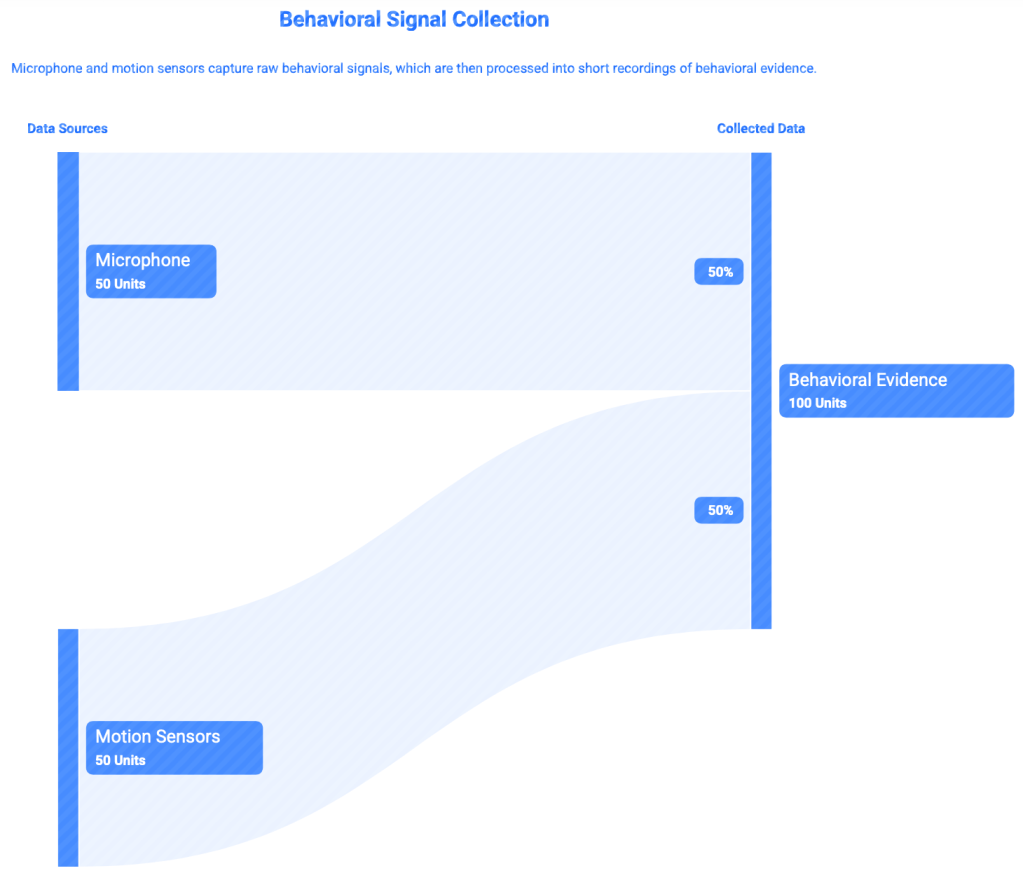
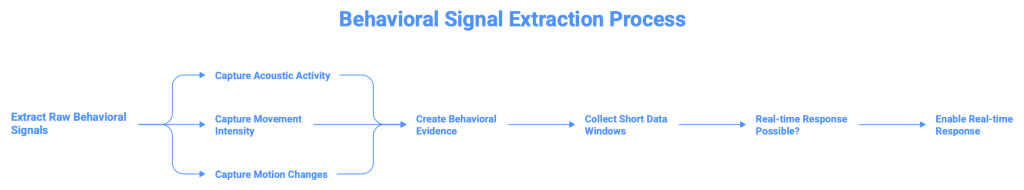
Extract: microphone and motion sensors gather behavioral signals.
The device extracted raw behavioral signals from the real world. The microphone captured acoustic activity. The accelerometer and gyroscope captured movement intensity and motion changes. Each five-second recording became a small piece of behavioral evidence. During live use, the system collected short windows of data rather than waiting for an entire session to end. That made a real time response possible.
In simple terms: The device extracted raw behavioral signals from the real world. The microphone captured acoustic activity. The accelerometer and gyroscope captured movement intensity and motion changes. Each five second recording became a small piece of behavioral evidence. During live use, the system collected short windows of data rather than waiting for an entire session to end. That made a real time response possible.
Transform: code converts raw readings into features such as audio RMS and motion variation.
The transformation stage converted sound into measures such as audio RMS and peak-to-peak intensity. It converted movement into measurements such as movement mean, movement variation, and fidget related counts. These features were then compared against an individual baseline and translated into a stress-proxy score. This mattered for both privacy and efficiency. A product doesn’t always need to transmit an entire raw audio file to understand whether sound intensity has increased. Transmitting compact features instead of continuous raw recordings reduces bandwidth and makes the architecture more privacy conscious.
In simple terms: The system turned raw sound and movement into usable clues, comparing them with the user’s baseline to flag unusual patterns. It sent compact features instead of full recordings, faster, more private, and far less dramatic than uploading your entire sigh.
Load: processed features are stored, displayed, or sent through a messaging/cloud pipeline.
After feature extraction and scoring, the data could be loaded into the communication and monitoring system.
The device could store files locally, including WAV, CSV, or NDJSON records, while MQTT messaging transported compact feature payloads. In the larger architecture, AWS IoT Core acted as the cloud entry point; EC2 or Python processing handled scoring and decision logic; S3 stored timeseries logs; and a Streamlit dashboard visualized behavioral trends. When elevated patterns persisted, the design also supported an SNS alert. This meant that the device observed a behavior, converted it into a score, sent the score through the pipeline, saved the record, displayed the trend, and responded when the pattern lasted long enough to matter.
In simple terms: The device saved the evidence, sent compact updates through the pipeline, and displayed the pattern on a dashboard. If elevated activity continued, it could trigger an alert, because one dramatic sigh is a moment, but a pattern deserves attention.
Why Sound and Motion Were Chosen
Once the device could recognize changes in behavioral signals, the next challenge was deciding how to present those changes to the user without making the experience feel clinical, confusing, or stressful.
Sound and motion were chosen because they are visible parts of human behavior that don’t require invasive physiological sensing.
The collected sounds were especially intentional. A quiet baseline represented the user’s low-activity reference point. Humming represented sustained vocal activity. Sighing or screaming represented higher-intensity vocal expression. Sucking teeth represented a short, sharp sound that we included as a possible frustration related behavior in the prototype.
The motion behaviors followed the same logic. Shaking represented broad movement. Tapping represented repetitive movement. Fidgeting represented small, restless activity that can emerge during boredom, mental effort, nervousness, or stress.
Psychologically, these are behavioral proxies. They don’t reveal someone’s private emotional state with certainty. They simply provide measurable, external signals that may change when someone’s under pressure. That’s why personalization matters. One person’s ordinary studying behavior may look like another person’s stressful session. A strong product should learn the user’s normal patterns before generating interpretations.
In simple terms: The device tracked sound and motion as behavioral clues, not proof of stress. By comparing patterns to each user’s baseline, it made feedback more personal and context aware.
The Product Had to Look Like Something People Could Understand
A sensor becomes meaningful when its output becomes visible, so UX, or user experience design, became an important part of the product.
On the Core2 screen, the experience was deliberately simple and immediate. Once the device could recognize changes in behavioral signals, the next challenge was deciding how to present those changes to the user without making the experience feel clinical, confusing, or stressful.
- Green signaled no activity.
- Amber signaled sound activity.
- Purple signaled motion activity.
- Red represented combined elevated sound and movement, accompanied by a “Break recommended” message.
The screen was not designed to frighten the user. Unless your goal is to make horror films, do not frighten your user. The product was designed to interrupt autopilot.
The planned dashboard experience was designed to extend the product by displaying feature windows and behavioral trends over time, similar to what you see on a health-tracking app. Instead of receiving a vague message that you might be stressed, the user could see what changed: movement rose, sound intensity increased, and the pattern continued across multiple windows.
The appearance of the product as part of the psychology and User UX. The interface was designed to make feedback understandable, immediate, and visually calm rather than overly clinical or alarming. The product was made with the intention of de-stressing, not stressing, the user.
What was Actually Built
It began by trying to build a stress-detection product. What was created was more thoughtful than that: a behavioral-awareness product capable of detecting moments when sound and movement patterns changed from baseline in ways that could be consistent with stress, fatigue, distraction, or cognitive overload.
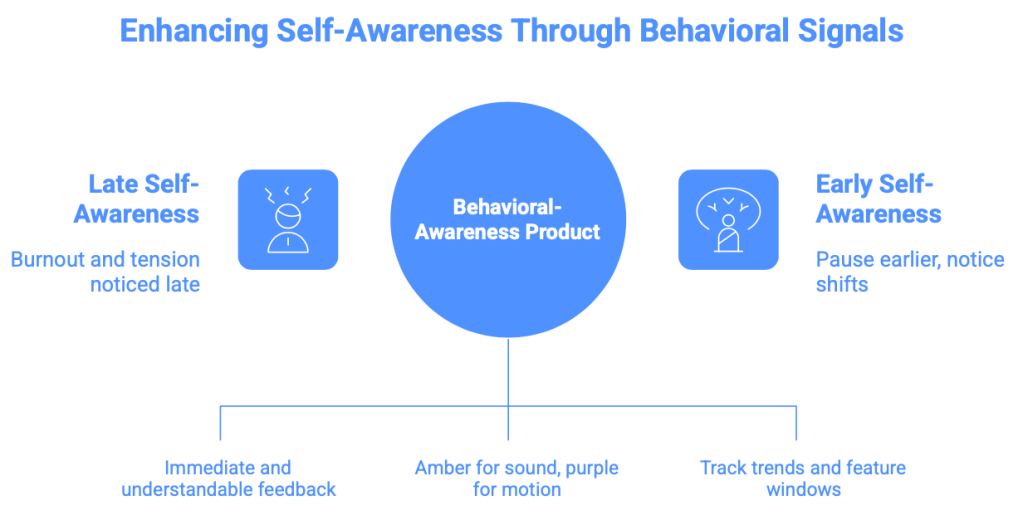
That matters because self awareness often arrives late. Most people only notice burnout after the work is done and the burnout has, well, burned out. Often, we recognize tension only after our concentration has already disappeared. A product that gently signals, “Your pattern has shifted,” creates an opportunity to pause earlier.
The future version would need more diverse sessions, self-reported stress labels, improved privacy safeguards, and stronger validation before making broader claims. It could also incorporate physiological signals, such as heart rate or skin conductance, to strengthen accuracy.
But the prototype already revealed something valuable in the build: sometimes the most useful technology is not the technology that claims to know exactly how we feel. Sometimes it is the technology that helps us notice ourselves sooner. In a world obsessed with productivity, perhaps the next meaningful device is not one that pushes us harder, but one that finally notices when we need a break.
