Blog Post By: Yari
Date: August 7th, 2026
Daphne Blake from Scooby-Doo doesn’t get enough credit. Everyone remembers Fred and his ascot, Velma and her glasses, Shaggy and Scooby making sandwiches like they’re training for the snack Olympics, as if they’d ever lose.
But Daphne?… Daphne was always polished, strategic, high context decision maker (and a great martial artist). The girl could walk into a haunted mansion in a coordinated fit, clock the suspicious behavior, survive a trap door, and still look ready for brunch.
That’s exactly why she’d be a perfect analogy for reading a Form 10-Q.
A Form 10-Q is basically a company’s quarterly financial confession. It tells investors how the business is performing, what changed, where the cash went, how much debt exists, what risks are lurking, and whether management is saying everything’s fine in a tone that makes you immediately check the footnotes.
A Form 10-Q isn’t the cute shopping window, it’s the fitting room lighting (the make or break moment). And if you are going to shop for companies, stocks, business models, or investment ideas, you shouldn’t just look at the brand name and pretty aesthetics. You need to know if the company can actually afford the cute fits it’s promising.The uploaded Python project gets this exactly right: it’s a Form 10-Q Financial Statement Analyzer built to parse, analyze, and visualize SEC Form 10-Q financial data. In simple terms it takes the messy quarterly report and turns it into something readable, comparable, and much less likely to make your brain leave the group chat you didn’t even ask to be in. Not every group chat is enlightening, but some do have excellent drama.
Your new to finance, let me explain what an Form 10-Q is:
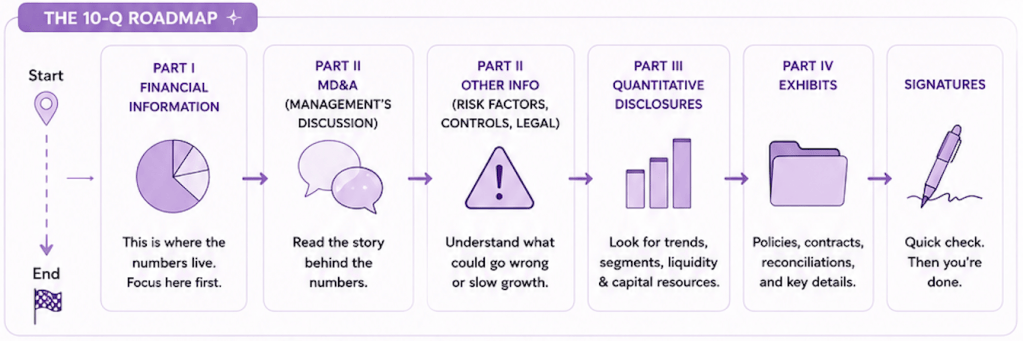
A Form 10-Q is a quarterly report public companies file with the SEC. It usually includes unaudited financial statements, management discussion, risk updates, controls, and other disclosures. Think of it as the company’s mid-season recap. The annual report is the 10-K, the full documentary, while the 10-Q is the quarterly episode.
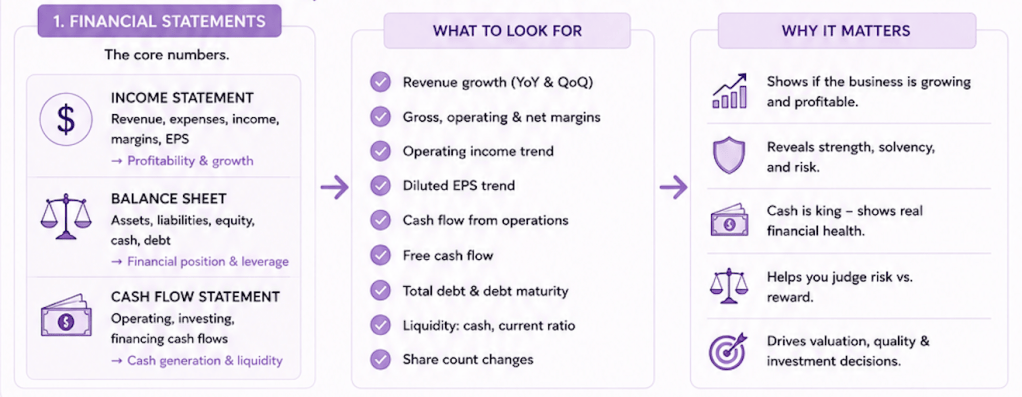
It tells you: revenue, expenses, income, assets, liabilities, equity, cash flows, and whether the business is moving like a healthy company or like a mystery van with one wheel missing.
It matters since companies can look amazing from the outside with strong branding, big partnerships, fancy commercials and a CEO talking like they invented the future for the next 10 year. But the financial statements tell you whether the business is actually making money, managing debt, generating cash, and growing efficiently.
That’s where Daphne comes in. Daphne wouldn’t buy the shiny purple dress just because it looked cute on the hanger. She would check the fabric, the fit, the price, the stitching, and whether Velma already saw it on sale somewhere else.
That’s how you read a 10-Q. It’s not about being famous, it’s about being financially healthy.
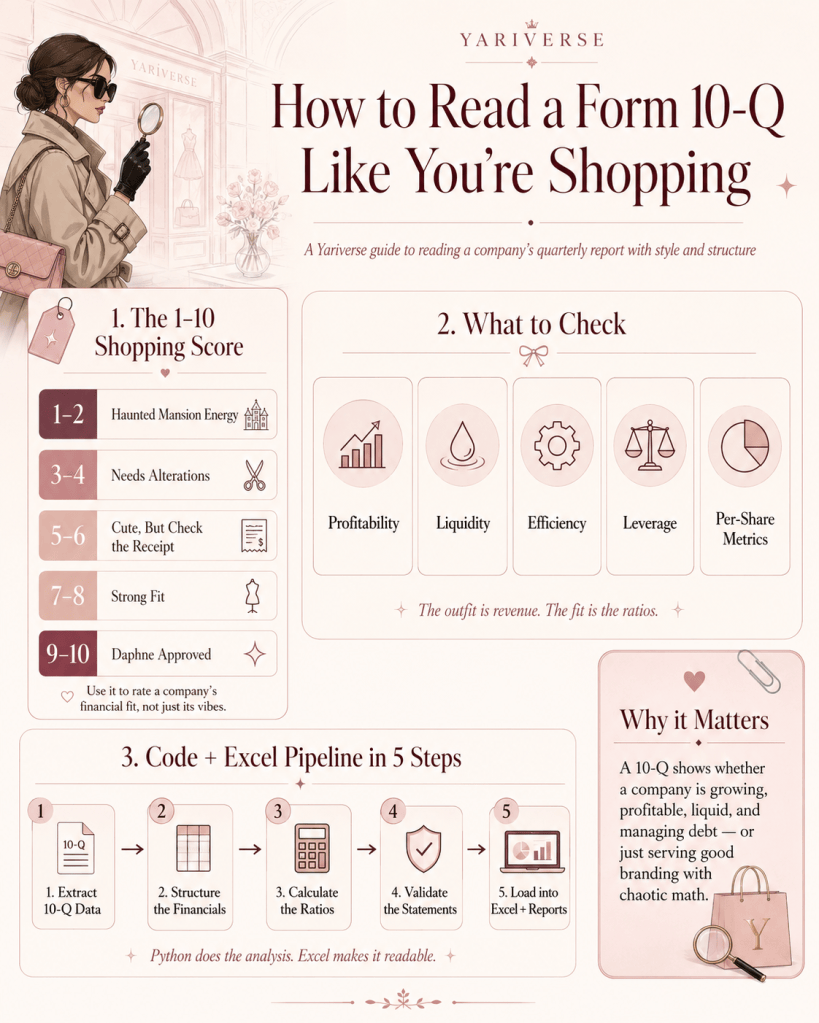
The Daphne Blake 1-10 Shopping Score
To make Form 10-Q analysis less terrifying, we’ll use a 1-10 company shopping score as a smart personal framework for reading a company’s quarterly report without getting too lost by a good logo.
- 1-2: Haunted Mansion Energy:
The company has weak profitability, poor cash flow, too much debt, or messy fundamentals. This is where you ask: why are the lights flickering I just changed the blue? - 3-4: Needs Alterations:
Some pieces work, but the company has clear issues. Maybe revenue is growing but profits are thin, the debt is high, or the cash flow isn’t matching the story. - 5-6: Cute, But Check your Amex spending:
The company’s not terrible, but it’s not an automatic yes. You need more context, trend analysis, and comparison against competitors. - 7-8: Strong Fit:
Good revenue, solid margins, manageable debt, decent cash flow, and improving trends. This is the company equivalent of finding something that fits on the first try. - 9-10: Daphne Approved:
Strong growth, strong profitability, healthy liquidity, solid cash flow, manageable leverage, and a business model that looks resilient. Not perfect, but very polished. The point isn’t to reduce investing to one cute score, it’s to create a mental checklist. Remember, liking a company is not analysis.
What the Code Analyzes
The Python analyzer is built around Mastercard Q1 2026 financial data (we’re using Mastercard as a quick simulation). The code stores income statement, balance sheet, and cash flow data, then calculates financial ratios across profitability, liquidity, efficiency, leverage, and per share metrics. The analyzer class is specifically designed as a comprehensive ratio calculator covering profitability, liquidity, efficiency, and leverage ratios.
The 10-Q isn’t just one number. Revenue alone doesn’t tell the full story:
- A company can grow revenue and still burn cash, show profit and still have debt stress, and even look stable this quarter and still have weak trends underneath.
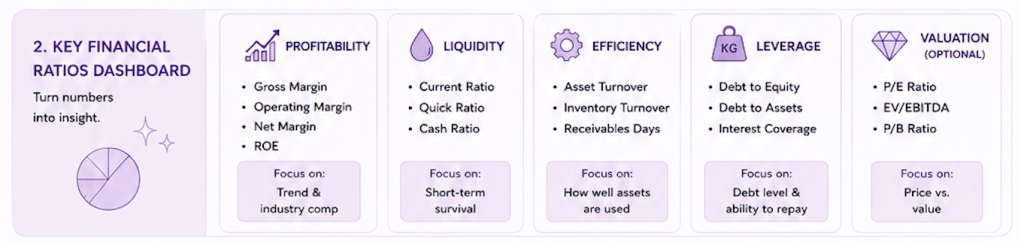
- The code breaks the company into five main categories, almost like Daphne checking an outfit from every angle before deciding whether it deserves to go on the vacay suitcase.
Profitability: Is the Company Actually Making Money?
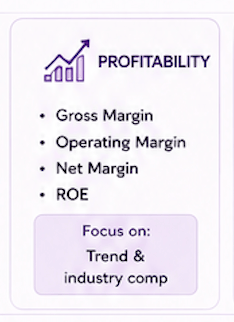
Profitability ratios answer the basic question: Is this business making money from what it sells?
The code calculates gross profit margin, operating margin, net profit margin, EBITDA margin, return on assets, and return on equity.
It’s the does the outfit fit section. Revenue’s cute, but margins tell you how much money stays after the business does the work. A company with high revenue but weak margins is like someone walking into a luxury store, buying the whole display, and then checking their account balance in the parking lot. Beautiful moment, but questionable sustainability.
Liquidity: Can the Company Pay Its Bills?
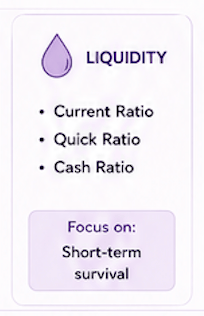
Liquidity ratios ask: Does the company have enough short term assets to handle short-term obligations?
The code calculates current ratio, quick ratio, cash ratio, working capital, and working capital ratio.
The corporate version of checking whether you can buy the dress and still pay rent. Liquidity matters since a company can be profitable on paper and still run into trouble if it can’t meet near term obligations. Cash isn’t everything, but when bills are due, brand awareness isn’t a payment method.
Efficiency: Is the Company Using Its Resources Well?
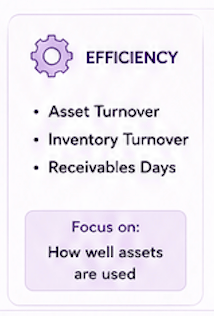
Efficiency ratios ask: Is the company turning assets, expenses, and operations into real performance?
The code calculates asset turnover, operating expense ratio, cost efficiency, and annualized EBITDA.
It’s where we ask if the company is doing too much or doing it well. A business that spends heavily but doesn’t convert that spending into income may be serving fashion week with clearance rack discipline. Efficiency tells you whether operations are tight or messy.
Leverage: How Much Debt Drama Is in the Room?
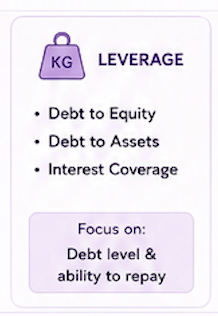
Leverage ratios ask: How much debt does the company carry, and can it handle the interest?
The code calculates debt-to-equity, debt ratio, equity ratio, interest coverage ratio, and debt-to-assets.
This is the haunted mansion inspection. Debt isn’t automatically bad. Companies use debt to grow, invest, and finance operations. But too much can make it fragile, especially when rates rise or revenue slows.
Interest coverage is important as it asks whether the company earns enough to cover interest expense. If interest coverage is strong, the company can breathe. If it’s weak, the company’s one bad quarter away from a Scooby-Doo chase scene.
Per-Share Metrics: What Does This Mean for Investors?
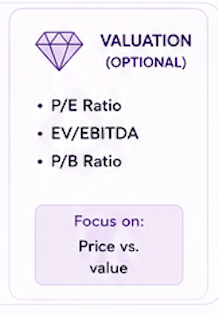
The code also calculates diluted EPS, book value per share, cash per share, and earnings yield.
This is where the analysis becomes more investor friendly.
Per-share metrics help connect the company’s financial performance to the investor’s perspective. The company may be enormous, but investors still want to know what each share represents. It’s the difference between looking at the whole boutique and asking, what your actually getting?
The Form 10-Q Parser: Turning the Filing into a Summary
The code includes a Form 10-Q parser that extracts key financial metrics and validates accounting principles. That’s important because a good financial analysis tool shouldn’t just calculate ratios, it should check whether the financial statements make sense. The parser extracts:
- the company name, filing date, CIK, report type, fiscal period, and key metrics like net revenue, operating income, net income, operating margin, diluted EPS, total assets, and total equity.
The parser basically pulls the important information into a readable summary. Daphne would approve while Velma would ask for the source data. Both are correct.
Validations: The Receipts Section
The analyzer validates the accounting equation:
Equity + Liabilities = Assets
As a foundational check, the parser compares total assets against total liabilities plus equity and flags whether the statement balances.
It then validates the cash flow reconciliation by checking whether net cash change equals operating cash flow plus investing cash flow plus financing cash flow plus currency effects.
The Excel Workbook, Finance’s Favorite Comfort Object
The Excel workbook creates a comprehensive financial analysis workbook with income statement, balance sheet, ratios, trends, and KPIs. Excel is still the universal language of finance, Python is powerful, but Excel’s where analysts check, the workbook includes:
- Income Statement, Balance Sheet, Financial Ratios, Quarterly Trends Key Metrics/KPI dashboard
The Code & Excel Pipeline in 5 Steps
This is the pipeline engine. You’ll need to familiarize yourself with this when you apply to that quant job.
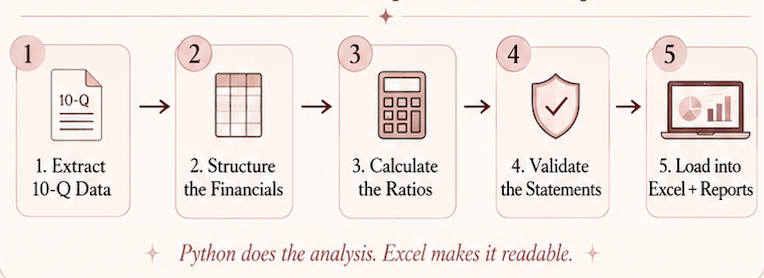
Step 1: Extract the 10-Q Data
The workflow starts by pulling or defining the financial statement data: income statement, balance sheet, and cash flow. It includes: revenue, expenses, operating income, net income, cash, assets, liabilities, equity, debt, and cash flow items.
Think shopping rack, you gather everything before deciding what’s worth trying on.
Step 2: Clean and Structure the Financials

The code organizes the data into dictionaries and classes so the analyzer can read it consistently.
- Income statement data goes into one structure.
- Balance sheet data goes into another.
- Cash flow data gets its own section.
This matters because messy data creates messy analysis. You can’t calculate ratios correctly if your inputs are scattered like Daphne’s luggage after a monster chase.
Step 3: Calculate the Ratios
The analyzer calculates profitability, liquidity, efficiency, leverage, and per-share metrics. It’s where the 10-Q becomes useful.
Net income is profitability, Cash flow is survival.
Raw financial statements tell you what happened, Ratios tell you what it means.
Step 4: Validate the Financial Statements
The code checks the accounting equation and cash flow reconciliation. It’s the part where the model asks before you make any conclusions, do the numbers actually tie?
The best analysts aren’t impressed by a pretty dashboard until the math makes sense.
Step 5: Load the Results Into Excel and Reports

The results are loaded into console reports and a formatted Excel workbook.
The workbook turns the analysis into something usable: income statement comparisons, balance sheet changes, ratio sections, quarterly trends, and KPI dashboards.
How to Use the 1-10 Score When “Shopping” Companies
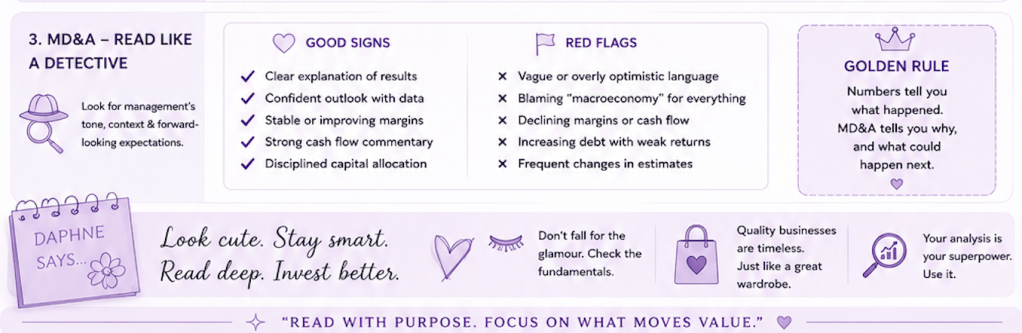
Once the ratios are calculated, use the 1-10 Daphne Shopping Score as a practical framework and score the company across five categories:
- Profitability, Liquidity, Efficiency, Leverage, Growth/trend quality
Each category can get 1 to 2 points.
- Profitability: 0-2 points → Are margins strong? Is net income growing? Is ROE healthy?
- Liquidity: 0-2 points → Can the company meet short term obligations? Is working capital stable?
- Efficiency: 0-2 points → Is the company using assets and expenses productively?
- Leverage: 0-2 points → Is debt manageable? Is interest coverage strong?
- Trend quality: 0-2 points → Are revenue, operating income, EPS, and cash flow improving over time?
Then add the score because even Daphne wouldn’t buy something just because it was cute, she’d check the price tag.
- 1-4: Proceed with caution (this should be a hell no)
- 5-6: Mixed picture → deeper research
- 7-8: Strong candidate → deeper analysis.
- 9-10: High quality profile → check valuation, risks, and competition.
Why This Project Works
This type of project is good to have as it connects finance, analytics, coding, and storytelling.
It shows that you can:
- Read a Form 10-Q, Extract key financial data, Calculate financial ratios
- Validate accounting relationships, Compare year-over-year performance
- Build a financial workbook, Create a KPI dashboard, Explain the results in plain English