
Blog post: Yari
Date: July 17th, 2026
It’ Finance Fridays…
There comes a special time in a girl’s life when she has to learn about credit ratings. I’m not talking about personal credit scores (that’ll be for another section); this is about the score banks run by for when they need to know Can this company, government, or bond issues repay debt or is it a red flag?
Listen up FinTech Girlie pop, you’re going to need to know this.
We’ll start this simple, whenever you think of credit ratings I want you to remember the Sheep Trick, especially like a sheep walking down a hill.
At the top of the hill, the sheep is safe, fluffy, pristine, and financially responsible, all a girl can dream to be. That is Aaa, Aa, A, and Baa: the investment grade zone. These are the stronger ratings, where lenders and investors generally feel more comfortable.
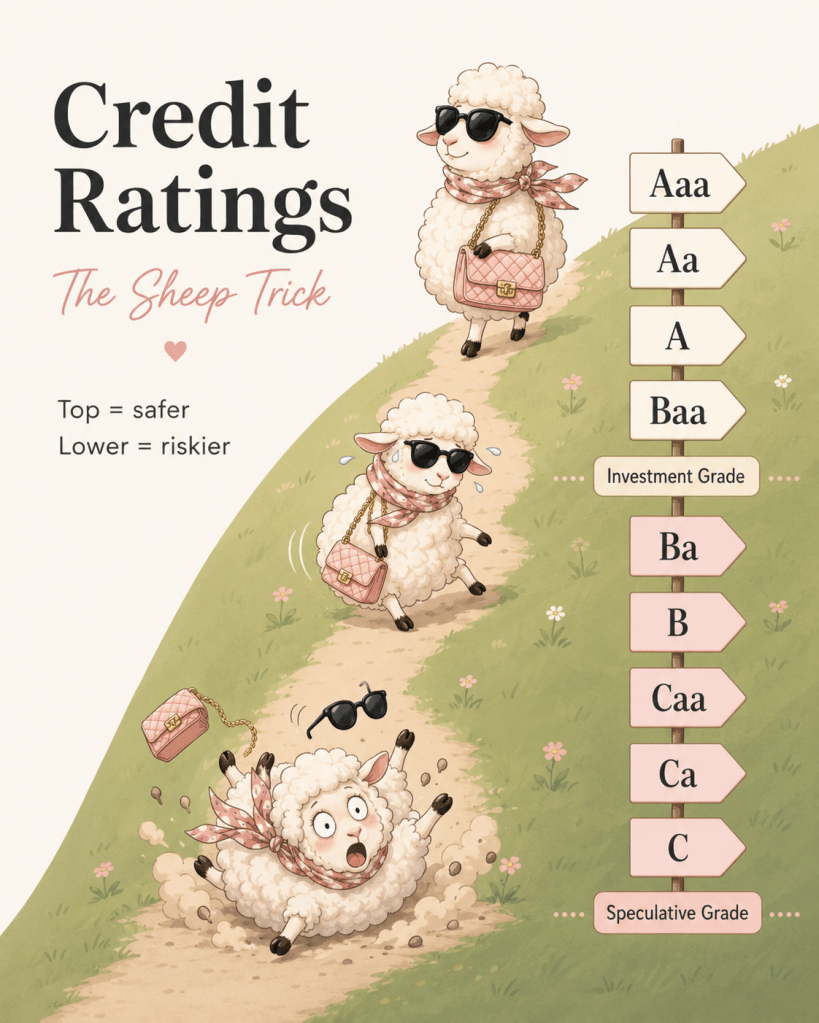
Then the sheep starts slipping. Once it crosses into Ba, B, Caa, Ca, and C, it has entered speculative grade territory. This doesn’t automatically mean default, but it does mean the risk is higher. The sheep are no longer calmly grazing. The sheep are sliding, concerned, and possibly calling its credit analyst for help if it had one (just look at its bag getting ripped, tragic).
Use SHEEP like this:
S : Strongest: Aaa
H : High quality: Aa and A
E : Edge of investment grade: Baa
E : Elevated risk: Ba and B
P : Problem credit: Caa, Ca, and C
The easiest way to remember it is:
A rated sheep are safe. Baa is the edge of the fence. Once the sheep falls into Ba and below, it is speculative grade pasture.
In finance terms:
Aaa to Baa = investment grade
Ba to C = speculative grade
- Investment grade sheep still has a savings account, a five year plan, and umbrella insurance.
- Speculative grade sheep has vibes, leverage, and a refinancing problem.
In a way credit ratings are actually very relatable, they help investors understand how risky it is to lend money to an organization. If bonds are a promise, credit ratings are the market’s trust issues written in letter form. Think of it as letting your friend Becky borrow your skirt because Becky has a record of always returning to it on time to everyone in your friendship group.
Credit Ratings.
Well, a credit rating is an opinion about the likelihood that a borrower can meet its debt obligations. For a company, that means: can it pay interest, refinance debt, generate enough cash flow, survive downturns, and avoid becoming the finance version of I’ll Venmo you later?
Credit ratings are used by investors, banks, lenders, portfolio managers, insurers, pension funds, and companies issuing debt. They matter as they influence borrowing costs. A stronger rating usually means a company can borrow at a lower interest rate. A weaker rating usually means lenders demand higher yields because they are taking on more risk.
Credit ratings are one of the most important tools in debt markets because they translate financial risk into a shared language.
The logic is simple:
- Low risk borrower: Sure, I’ll lend to you for less.
- High risk borrower: I need hazard pay.
That hazard pay shows up as higher interest costs, wider credit spreads, and sometimes reduced access to capital. In finance, much like high school, reputation is expensive. Bad credit can make borrowing feel like trying to get into a private club while wearing flip flops which unless your tech mongol is a no.
From Aaa to C
Credit ratings generally move from the strongest borrowers at the top to the weakest at the bottom. Here’s the simplified version:

- Aaa: The elite tier, with extremely strong credit quality. This is the financially unbothered and debt obligations are handled category.
- Aa: Very strong credit quality, just slightly below Aaa. Still excellent and investment grade, very much giving my balance sheet has boundaries.
- A: Strong credit quality. The company is solid, but there may be some business or market risks to watch for. Think: financially responsible, but susceptible to plot twists.
- Baa: Medium grade credit quality. This is the lowest major investment grade category. It’s acceptable, but investors start reading the footnotes more carefully. Think: invited to the investment table, but people are checking its references for any faults.
- Ba: Speculative grade begins here. The company may still be functioning, but the risk is meaningfully higher. This is where investors say, Interesting opportunity but their risk team says, Let’s not get emotionally attached.
- B: Highly speculative. The company has weaker financial flexibility and may struggle under stress. This isn’t necessarily default energy, but it’s definitely one to watch closely.
- Caa: Very high credit risk. The company may be vulnerable to default or dependent on favorable conditions to survive. This is when the spreadsheet starts sweating and so will you if you let them borrow.
- Ca: Extremely speculative. Default may be near or recovery prospects may be weak. This isn’t just red flag, it’s the red flag organizing a parade for red flags.
- C: The absolute lowest tier. Usually associated with default or very weak prospects for recovery. This is where the credit story has entered its final season chaos arc, and a place you should generally avoid even looking in its direction.
In a dashboard, the model maps scores from 1 to 9, where 1 is strongest and 9 is weakest. Investment grade includes Aaa, Aa, A, and Baa. Speculative grade includes Ba, B, Caa, Ca, and C.
The distinction matters since investment grade and speculative grade are not just labels. They affect who can buy the debt, how expensive borrowing becomes, and how the market treats the issuer. Some institutional investors are restricted from holding speculative grade debt. So, when a company falls below investment grade, it’s not just embarrassing. It can change the investor base overnight. A downgrade can be less bad report card and more you’re no longer allowed at this table.
Why Credit Ratings Matter
Credit ratings matter because debt markets run on trust, and trust needs a pricing system. A strong rating can help a company borrow at lower rates, issue bonds more easily, and reassure investors. A weak rating can make debt more expensive, limit access to funding, trigger covenant concerns, or scare off conservative investors.
Credit ratings influence:
- Borrowing costs, Bond yields
- Credit spreads, Investor demand
- Portfolio eligibility, Risk management
- Capital structure decisions, Lender confidence
- Market perception
For companies, ratings can shape strategic decisions. Should they issue more debt? Refinance now? Reduce leverage? Delay an acquisition? Preserve cash? Avoid risky expansion? A credit rating is not just a badge. It is a signal to the market.
For investors, ratings help compare risk across issuers. They’re not perfect, and they shouldn’t be blindly worshipped like a financial astrology chart. But they create a starting point for credit analysis. Credit ratings are not the whole truth, but they are the opening scene.
How the Model (the excel attached) Calculates Ratings
The cash flow schedule is where the bond becomes tangible. The model builds a The model used in the project attached to this uses a educational scorecard. It’s not Moody’s real methodology, and that matters. Real rating agencies use proprietary methods, qualitative judgment, forward looking analysis, sector specific frameworks, governance review, legal structure, country risk, and analyst interpretation. This project simplifies the process into a transparent quantitative model that can be explained, audited, and used for learning.
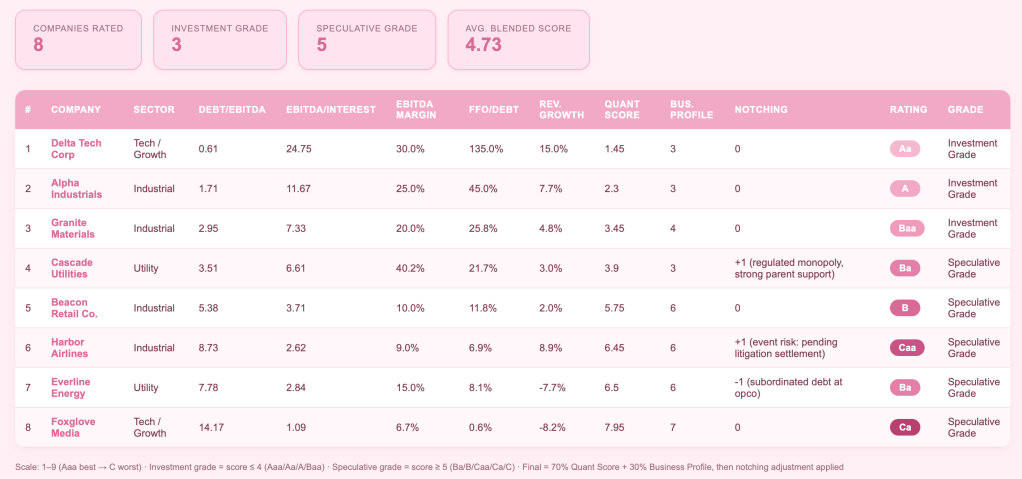
Each ratio tells a different part of the credit story. The dashboard calculates ratings using five financial ratios:
- Debt/EBITDA
- EBITDA/Interest
- EBITDA Margin
- FFO/Debt
- Revenue Growth
Debt/EBITDA: The Leverage Check
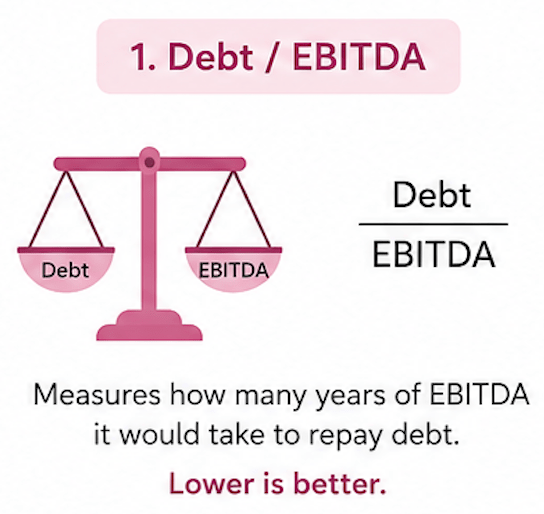
Debt/EBITDA measures how many years of EBITDA it would take to repay debt, assuming EBITDA were used for that purpose.
Formula: Debt / EBITDA
This is the how heavy is your debt backpack? metric.
A lower number is better. If a company has low debt relative to earnings, it has more financial flexibility. A company with a score of 0.6 is traveling light.
A lower number is high; the company may be overleveraged. A company with above 10 is trying to hike Everest in heels.
EBITDA/Interest: The Coverage Check
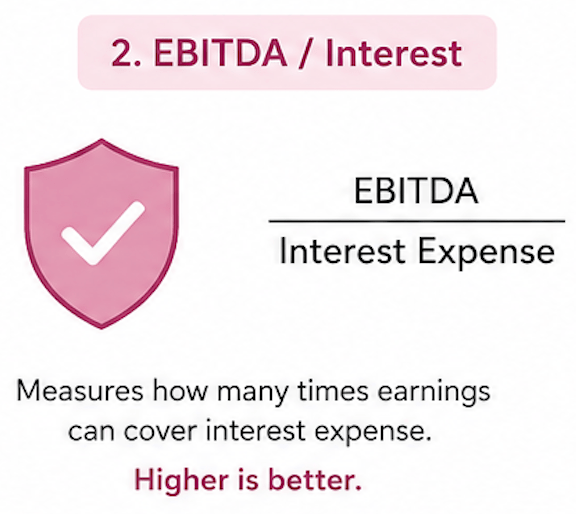
EBITDA/Interest measures how many times a company’s earnings can cover its interest expense.
Formula: EBITDA / Interest Expense
This is the can you afford the minimum payment? metric.
A higher number is better. If a company earns far more than its interest payments, lenders feel safer. High coverage says; We’re fine.
If interest coverage is low, the company may struggle to service debt. Low coverage says; Please don’t raise rates again.
EBITDA Margin: The Profitability Check
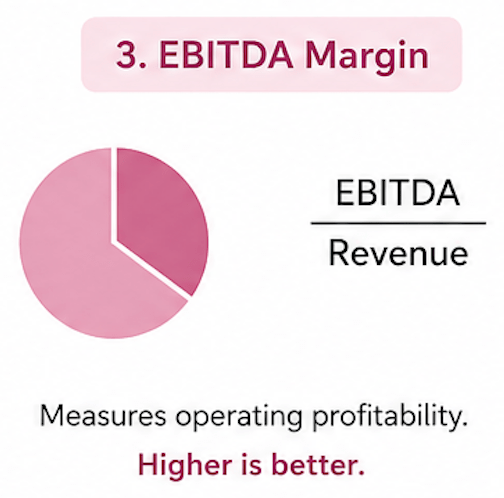
EBITDA margin measures operating profitability.
Formula: EBITDA / Revenue
This is the how much money do you keep after doing the work? metric.
A higher margin means the company keeps more earnings from each dollar of sales.
Strong margins often suggest pricing power, efficiency, or a better business model.
A company with strong revenue but weak margins is like someone with a glamorous lifestyle and no savings. The optics are great, but the math isn’t there.
FFO/Debt: The Cash Flow Check
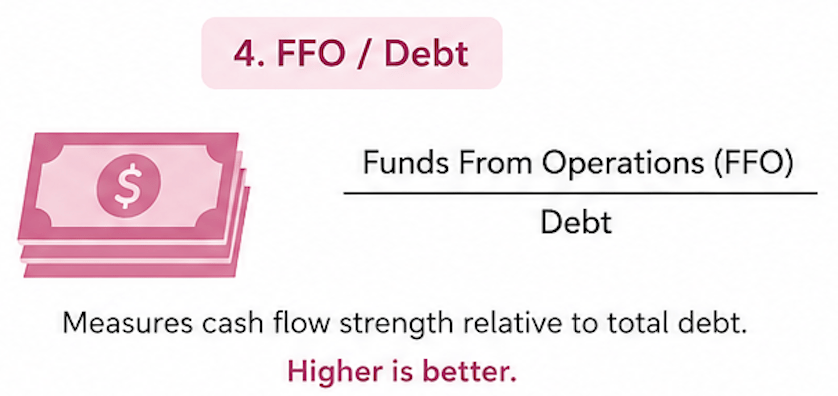
FFO/Debt compares funds from operations to total debt.
Formula: Funds From Operations / Debt
FFO/Debt is the do you have actual cash flow or just aesthetics? metric.
A higher number is better since it means the company generates more cash flow relative to what it owes. This is important since accounting earnings are cute, but cash pays bills.
A company can look profitable and still be cash stressed. Credit analysts care deeply about cash because lenders don’t accept brand awareness as payment.
Revenue growth shows whether the company’s sales are expanding or shrinking.
Revenue Growth: The Business Momentum Check
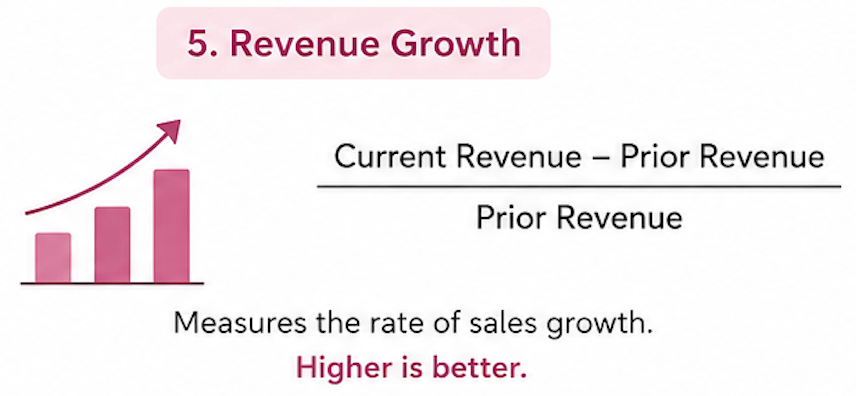
Formula: (Current Revenue – Prior Revenue) / Prior Revenue
Growth is the is the business still moving? metric.
Growth isn’t automatically good, and decline isn’t automatically fatal. But revenue trends help show whether the business is gaining traction, stagnating, or losing ground.
- Strong growth can support a better credit profile if it comes with profitability and manageable leverage.
- Weak or negative growth can pressure ratings, especially if debt is already high. Always remember growth without cash flow is just a motivational quote in Excel, it’s dangerous to rely on and can lead to bankruptcy really quick.
From Ratios to Scores
The model scores each ratio on a scale from 1 to 9.
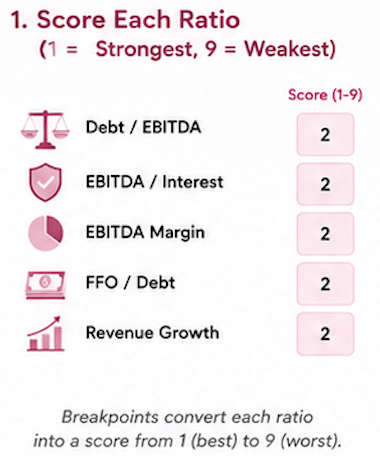
- 1 = strongest
- 9 = weakest
That means each financial metric gets translated into a risk score.
- Strong leverage, strong interest coverage, strong margins, strong FFO/Debt, and positive revenue growth push the score toward the stronger end.
- Weak ratios push the score toward the weaker end.
Then the model combines the ratio scores using weights.
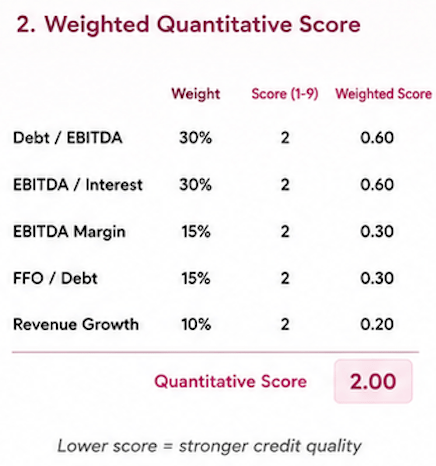
The dashboard notes that the five ratios are scored through breakpoint tables and combined with sector specific weights into a quantitative score.
Not every ratio matters equally in every industry, a regulated utility, for example, may naturally carry more debt than a software company. A capital intensive business shouldn’t be judged exactly like an asset light tech firm. Sector matters, it’s why the model includes sector logic, even though it remains educational and simplified enough to learn.
Business Profile Score: The Qualitative Reality Check
Numbers matter, but they don’t tell the whole story. The model blends the quantitative score with a business profile score. In the dashboard, the final score uses a 70/30 blend:
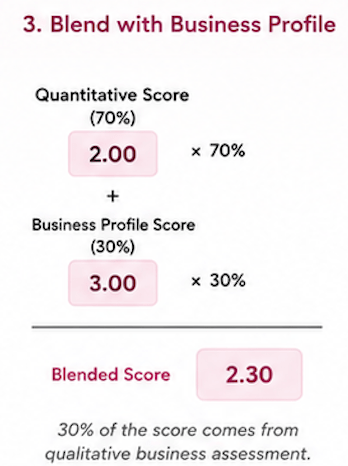
- 70% quantitative score
- 30% business profile score
The business profile score represents qualitative factors such as competitive position, business stability, industry quality, market share, customer concentration, management strength, and resilience. A company can have decent ratios but a weak business model. Another company can have temporarily pressured metrics but a very strong competitive position.
The business profile score is the model saying: Let’s not let Excel be the only responsible adult in the room in a room full of other adults.
Notching: The Adjustment Layer
After blending the quantitative and business profile scores, the model applies notching. Notching adjusts the rating up or down for structural, legal, or event risk factors. Examples include:
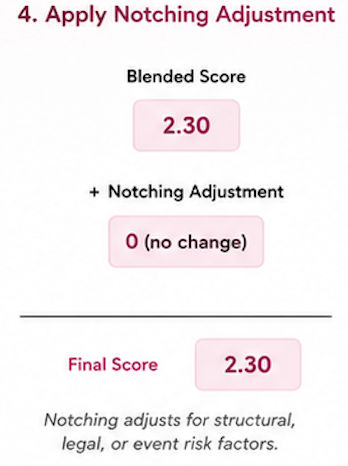
- Parent company support, Regulated monopoly position
- Subordinated debt, Pending litigation
- Guarantees, Covenants, Structural subordination, Event risk
In the dashboard, Cascade Utilities receives a +1 notching adjustment because of regulated monopoly characteristics and strong parent support. Harbor Airlines receives a +1 adjustment because of event risk from pending litigation settlement. Everline Energy receives a -1 adjustment due to subordinated debt at the operating company level.
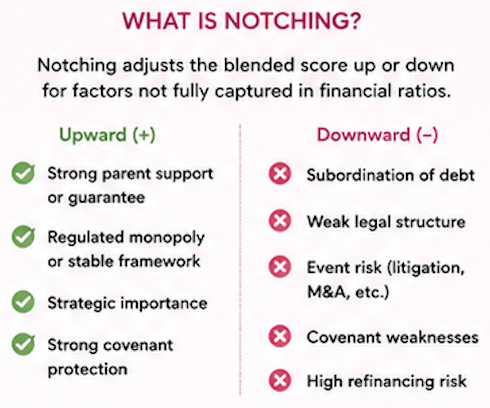
Notching is where the model admits that debt doesn’t exist in a vacuum. Legal structure, priority of payment matters, guarantees and corporate family structure also matters.
Not all debt sits at the same table. Some debt gets served first others wait.
Mapping Scores to Ratings
After the weighted score and notching adjustment, the model maps the final result to a letter rating.
- A lower blended score means stronger credit quality.
- A higher blended score means weaker credit quality.
Simplified mapping:
1 = Aaa
2 = Aa
3 = A
4 = Baa
5 = Ba
6 = B
7 = Caa
8 = Ca
9 = C
This is how the model turns financial metrics into a rating. For ex, in the dashboard:
- Delta Tech Corp has strong metrics, including low leverage, high interest coverage, strong margin, high FFO/Debt, and strong revenue growth. It receives an Aa rating and is investment grade.
- Alpha Industrials also has strong credit metrics and receives an A rating.
- Granite Materials receives Baa, still investment grade, but closer to the edge.
- Beacon Retail Co., Harbor Airlines, Everline Energy, and Foxglove Media fall into speculative grade, meaning the model sees greater credit risk.
- Foxglove Media is especially weak in the model, with very high Debt/EBITDA, low interest coverage, low margin, weak FFO/Debt, and negative revenue growth. It receives a Ca rating.
That is the model saying: This company is not just struggling; the spreadsheet is lighting a candle.
ETL Pipeline
The Jupyter notebook in this article is the analytical engine. You’ll need to familiarize yourself with this when you apply to that quant job.
Python ETL Pipeline:
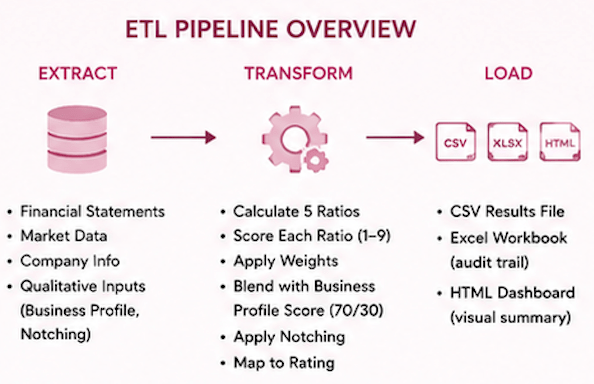
The ETL Pipeline: How the Credit Rating Engine Works
The credit rating model also works like an ETL pipeline: Extract, Transform, Load.
ETL sounds like one of those corporate phrases said by someone who owns multiple monitors, but it is actually a clean way to understand the workflow. The model takes raw company financials, transforms them into ratios and credit scores, then loads the outputs into a CSV, Excel workbook, and HTML dashboard is for visuals. ETL is the backstage crew. The dashboard gets the applause, but ETL makes sure the numbers are dressed, scored, and ready for their investor facing closeup.
In Extract the model collects company level inputs such as:
- Company name, Sector, Debt, EBITDA, Interest expense
- Revenue, Revenue growth, Funds from operations
- Business profile score, Notching adjustment
These inputs are the raw ingredients; without them the model couldn’t produce a meaningful rating.
Credit analysis is only as good as the data it extracts. Conceptually, the extract step looks like this:
- company = “Delta Tech Corp”
- sector = “Tech / Growth”
- debt = 120
- ebitda = 198
- interest_expense = 8
- revenue = 660
- ffo = 162
- revenue_growth = 0.15
- business_profile_score = 3
- notching_adjustment = 0
If debt is wrong = leverage is wrong.
If interest expense is wrong = coverage is wrong.
If FFO is wrong = cash flow strength is wrong.
In transform the model calculates the key ratios:
- Debt/EBITDA
- EBITDA/Interest
- EBITDA Margin
- FFO/Debt
- Revenue Growth
Then it scores each ratio from 1 to 9 based on breakpoint tables. Stronger ratios receive lower scores. Weaker ratios receive higher scores. Then the model applies weights to calculate a quantitative score.
Conceptually:
quant_score = (
leverage_score * leverage_weight +
coverage_score * coverage_weight +
margin_score * margin_weight +
ffo_debt_score * ffo_debt_weight +
growth_score * growth_weight
)
Then the model blends the quantitative score with the business profile score:
blended_score = (quant_score * 0.70) + (business_profile_score * 0.30)
Then it applies notching:
- final_score = blended_score + notching_adjustment
Finally, the final score maps to a rating:
- rating = map_score_to_rating(final_score)
This is the transformation layer, it turns financial data into credit judgment.
In load the model sends the final outputs into usable formats.
The CSV is useful because it gives clean structured output. It can be reused, filtered, imported, or analyzed elsewhere.
The Excel workbook is the audit trail. It lets users inspect the company metrics, scores, formulas, assumptions, and rating outputs. Excel remains finance’s favorite comfort object. It’s where analysts go when they want to trace the receipts of the latest group chat.
The HTML dashboard is the product layer. It turns the ratings into a visual experience with summary cards, a company table, color coded rating badges, investment grade/speculative grade classification, and methodology notes.
Why This Model Is Useful, But Not Official
Real ratings involve far more than five ratios and a weighted scorecard. They include analyst judgment, management quality, governance, competitive position, country risk, refinancing risk, event risk, legal structure, parent/subsidiary relationships, guarantees, covenants, forward looking expectations, sector specific methodology, and default rate calibration.
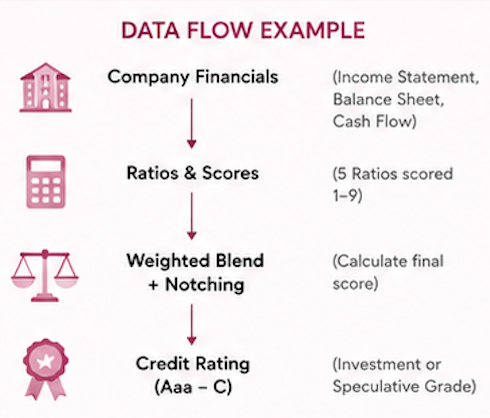
The model uses simplified real credit ratings because it doesn’t fully capture qualitative factors, sector specific grids, exact thresholds and weights, structural/legal notching, or forward looking analyst adjustments. That isn’t a weakness if framed correctly. It’s a responsible limitation.
The model isn’t pretending to replace a rating agency. It’s demonstrating how the mechanics of a rating scorecard work. It’s not the Supreme Court of credit risk, but it’s a very useful training simulator.

